
Not all experiments are done in laboratories and research stations. Part of the program in Western Australia to find workable solutions and strategies to improve staple strength in wools is very much “on-farm”.
Dr Chris Oldham who leads the “on-farm” team is starting to analyse the results of three years of intensive data gathering on a total of 61 flocks of hoggets on ten farms over three years in South Western Australia. It is the most comprehensive set of data of its kind ever assembled and will take time to analyse completely. However, The Wool Press asked him to give us a preliminary report.
This project was set up with two objects in mind; to benchmark the current systems of wool production by using ‘on-farm’ measurement of commercial flocks, and to test new strategies under commercial conditions. We took as many measurements as we were able on each flock and each farm to pinpoint common features that might be good or bad for the wool that was being produced. In measuring the wool, we were especially interested in those characteristics that influence processing performance, particularly the length of wool in the top, or the hauteur, because this is what early stage processors are looking for. The fibre diameter, length, strength and percentage of midbreaks were prominent among these because they are used in the prediction formula for estimating hauteur.
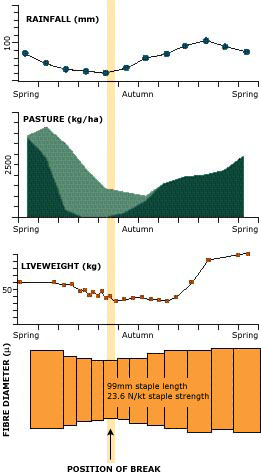
We worked exclusively with hoggets because they are the most likely to produce tender wool and, for the same reason, we confined ourselves to flocks that were shorn in the spring because they, too, produce wool that is generally less sound. As Figure 1 shows there are some pretty good reasons for this, associated with the available feed and the condition of the animals.
Let us look first at the way the animals grew each year over the period that we expected their wool to be at its weakest from early summer until well into the season of green feed (Figure 2). Each of the three years was unique; in 1995 the sheep were heavy and lost about 4 kg, in 1996 they maintained liveweight, and in 1997 they were very light at the beginning and gained about 10 kg. Apart from reminding us that on-farm experiments based on only one year’s results can be very misleading, it gave us a very good set of contrasting conditions in which to compare performances. The results in Table 1 show that the wool produced in these three years differed remarkably. This table certainly doesn’t give us all of the answers but it highlights a number of very important features that may surprise many producers as much as it did us.
| No. of flks | days of wool growth | No. hgts | CFW/hd | FD | VM | SL | SS | PMB | TEAM Ha | Wool $* | |
|---|---|---|---|---|---|---|---|---|---|---|---|
| 1995 | 18 | 337 | 572 | 2.9 | 19.6 | 0.5 | 85 | 36 | 75 | 62 | 699 |
| 1996 | 22 | 349 | 518 | 2.7 | 18.7 | 0.6 | 92 | 31 | 81 | 61 | 829 |
| 1997 | 21 | 322 | 531 | 3.1 | 20.1 | 0.4 | 94 | 4 | 54 | 63 | 649 |
Table 1. Analysis of the wool and predicted processing performance of all flocks monitored in each year
The soundest wool (36 N/Ktex) was produced in the year that the animals lost weight over autumn (1995) and, to emphasise the point, the animals that were gaining weight constantly and rapidly in 1997 had wool that not only was less sound, in fact it was tender! The 1996 animals that neither gained or lost weight were intermediate in strength and were significantly finer as well. On the face of it, it almost seems that a strategy for ensuring sound wool in young sheep would be to have them lose weight over autumn. This, of course is not a good idea. There were a lot of other factors in operation in the three years in question. The 1995 sheep started the year about 9 kg heavier than the 1997 sheep and were much better able to buffer themselves against short term nutritional stress. 1997 was characterised by having continual unseasonal green feed over autumn. Did that make the difference? and if so why? We are still analysing the data to see if they can provide the answers.
In the end, the hauteur was comparable in all three years. The tender wool of 1997 was longer and broader than the sound wool of 1995 which resulted in an identical estimated length of wool in the top. Nonetheless, the hoggets of 1996 which maintained themselves throughout the autumn, turned out to be the most profitable by far because their wool was sound and finer than that produced in the other two years.
And what of the return to the woolgrower from hand feeding? We had some interesting and surprising results in this facet of the work as well. Most farmers fed their young sheep some form of supplement for some period of the autumn in 1997, usually oats, lupins or hay. The three scatter graphs in figure 3 show what these supplements did for the predicted hauteur. Those flocks that were fed hay or lupins did not produce wools of better hauteur than those that did not receive the supplements and, of all things, in those that were fed oats, the more supplement they received the poorer the hauteur. Again, the results appear, on the face of it, to be strange and they re-emphasise the hazards of “on-farm” research. Results are one thing, interpreting them is another. For example, in this case, we need to determine whether some producers fed little or no supplements simply because their animals were already getting adequate feed in the paddock. Or, did those that needed to supplement their animals give them enough to have an effect?
These preliminary data are clearly showing that tender wool is not just a result of poor nutrition at particular times of the year. It is an involved interaction between a number of management and environmental factors that are not constant from year to year. Now that the last of the data for the three year project has come in, we are in a position to analyse an unequalled set of information that we expect will unravel some of its mysteries.
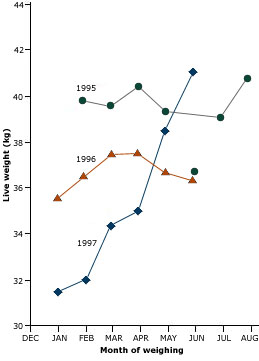
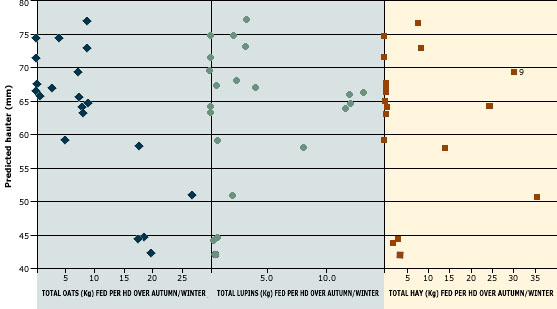
Figure 3. The relationship between the amount of supplementary oats, lupins or hay fed to hoggets in summer/autumn 1997 and the predicted hauteur of the wool that they produced.
In this issue of The Wool Press:
- A chain is only as strong as its weakest link
- Crimp — How important is it in modern wool?
- First in the west — New students graduate in Wool Science
- What’s happening out there?
- Laying the foundations for good wool
- Speeding up transgenics in a test tube
- Phil Hynd is new head of Animal Science in Adelaide
- From the director